Data Visualizations and Dashboards
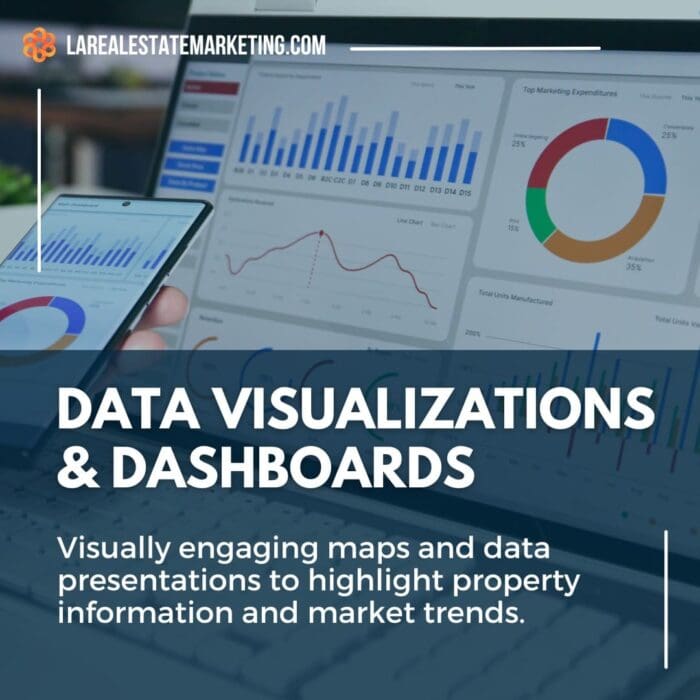
Our Data Visualizations and Dashboards service provides an innovative and detailed way to present property or market information. By creating Power BI reports and visualizations, we offer clients a comprehensive understanding of the property’s data, demographics, and market trends.
This service allows users to visualize data in a clear and engaging manner, making it easier to understand the property’s value and potential. With our expert data visualization techniques, buyers can gain deeper insights into the property’s context, enhancing their decision-making process.
High-quality custom maps and visualizations ensure that every aspect of the property’s data is presented effectively, providing a captivating and informative viewing experience.
Related products
Our Data Visualizations and Dashboards service provides an innovative and detailed way to present property or market information. By creating Power BI reports and visualizations, we offer clients a comprehensive understanding of the property’s data, demographics, and market trends.
This service allows users to visualize data in a clear and engaging manner, making it easier to understand the property’s value and potential. With our expert data visualization techniques, buyers can gain deeper insights into the property’s context, enhancing their decision-making process.
High-quality custom maps and visualizations ensure that every aspect of the property’s data is presented effectively, providing a captivating and informative viewing experience.

Related products
Ready to Transform Your Real Estate Strategy
Partner with LA Real Estate Marketing to elevate your property listings with our comprehensive Offering Memorandums. Our expert team, innovative tools, and tailored strategies are here to help you achieve your real estate goals.


